Trading by Stratagem: Maneuvering Self Disposition
Any advice or information provided by this thread is for general advice only. Do not invest or trade based solely on this information. The following thread is not held responsible for any damage or loss in any trading profits. Past performance of any trading platform is not an indication of future results.
Self Disposition
Before hitching a position on any price action, a trader must not trade base on his feelings. It is the most difficult enemy to defeat. Self. Once a trader imposed himself to feelings, failure will follow on rationalizing the price movement of the market. Markets are dependent on the psychology of traders that is why Fear and Greed are the market's meter if the price will go down or going to the moon.
There are 3 key points on one's self to gain a strong foundation on analysis rather than deceitful notion.
Discipline
Discipline is a key factor to gain good profit and access less loss on trader's capital. It is the training of the mind to control the wrong feeling of luck and rationalize the situation on the price action.
Calmness
Once calmness is broken, disorganize trading setups may follow and strategy will change. It is better to recharge calmness by reading fundamental analysis on the market a trader is trading and re-analyze price action movement.
Focus
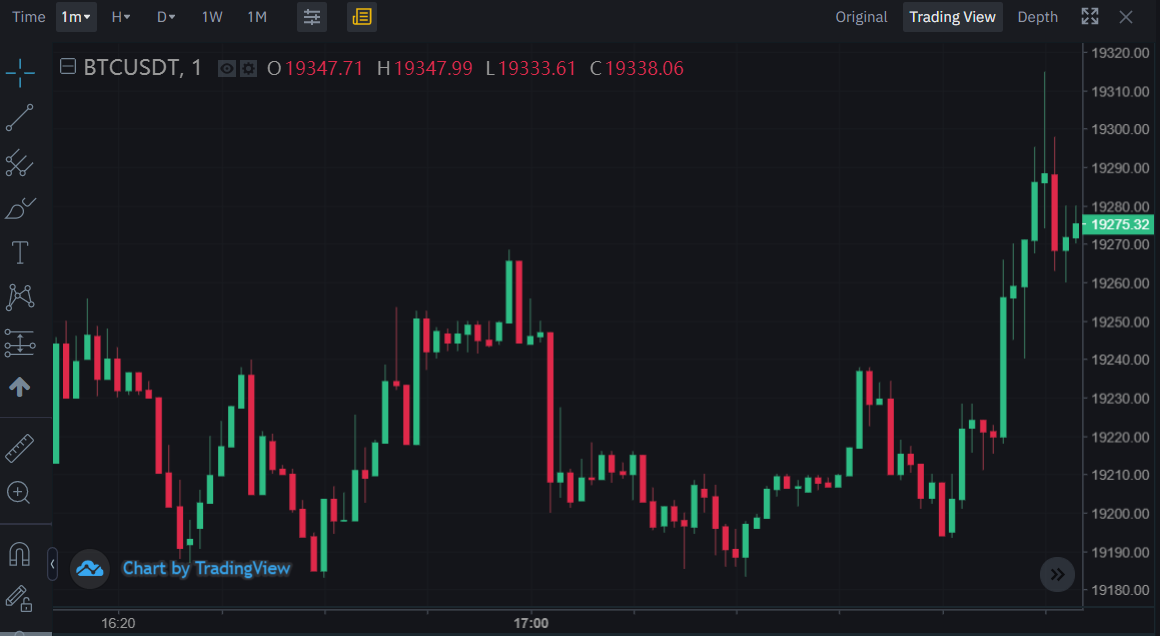
Focusing on trading setups is essential to curtailing losses by using lock-in profits, placing support and resistance in the 1-minute chart, quick decisions in an open/close position.
Maneuvering
Trend Direction
The above 4 key points is the reference for a trader to indicate more precise future price movement and lowers risk. There are also combinations of the 4 key points for a trader to win a trade. Most traders use MACD and Bollinger Bands back to back to indicate more precise future price movements.
The Bollinger Bands
It is a simple moving average(SMA) with plotted two standard deviations away from SMA. The enveloped SMA indicates the volatility and momentum of the market. If the price action is nearer on the lower portion of the envelope, it indicates low momentum. When the envelope is squeezed tight, it indicates low volatility and future swing is possible.
Before placing a trade with Bollinger bands. Look for an engulfing pattern or a Doji. Look at the below photo that has a blue circle in it. The blue circle indicates a non-engulfing pattern because of the position of the wicks and body. While the encircled yellow has Doji and Engulfing pattern from left to right.
MACD or Moving Average Convergence Divergence is a trend-following momentum that is displayed as bars with two Moving Average. The green arrows in the below photo are the sign of converging momentum that indicates possible swing. Red arrows are the divergence of the MACD that signals pullback after a swing of price movement. If the 2 moving average is above the momentum bar, the bull is winning. Opposite when under the momentum bar, bears are in control.
The chance of accuracy to win the trade is nearly possible in combining the two technical indicators. Two indicators are enough to use by any trading setup and can gain good profits if traded properly. Keep in mind that risk is inevitable and can be lessened by putting Stop Loss on every trade.


